Density of a Beta distribution on a bounded interval
Examples
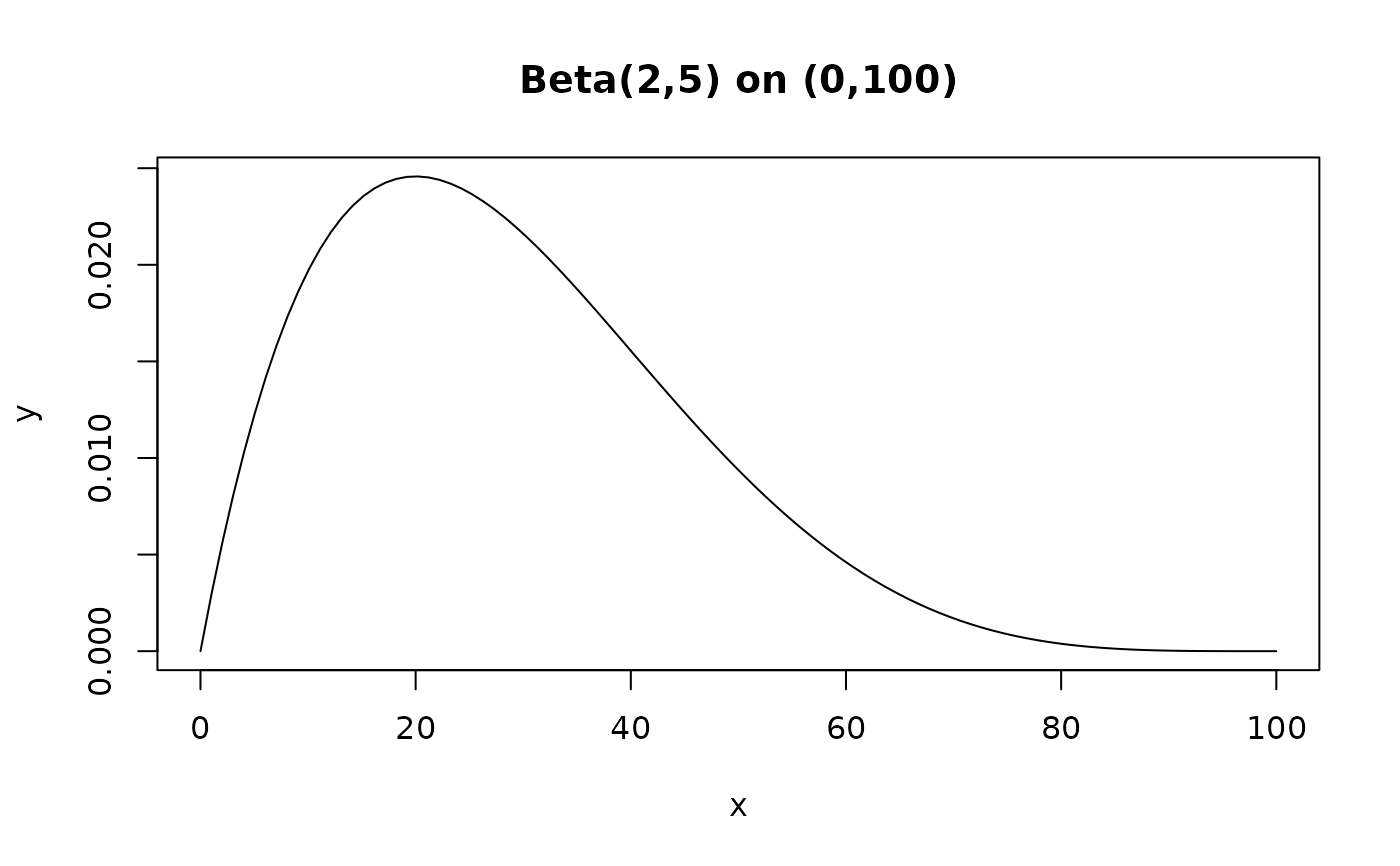
# Beta(2,5) on (0,100)
x <- seq(0, 100, length.out = 100)
y <- dbeta_box(x, shape1 = 2, shape2 = 5, a = 0, b = 100)
plot(x, y, type = "l", main = "Beta(2,5) on (0,100)")
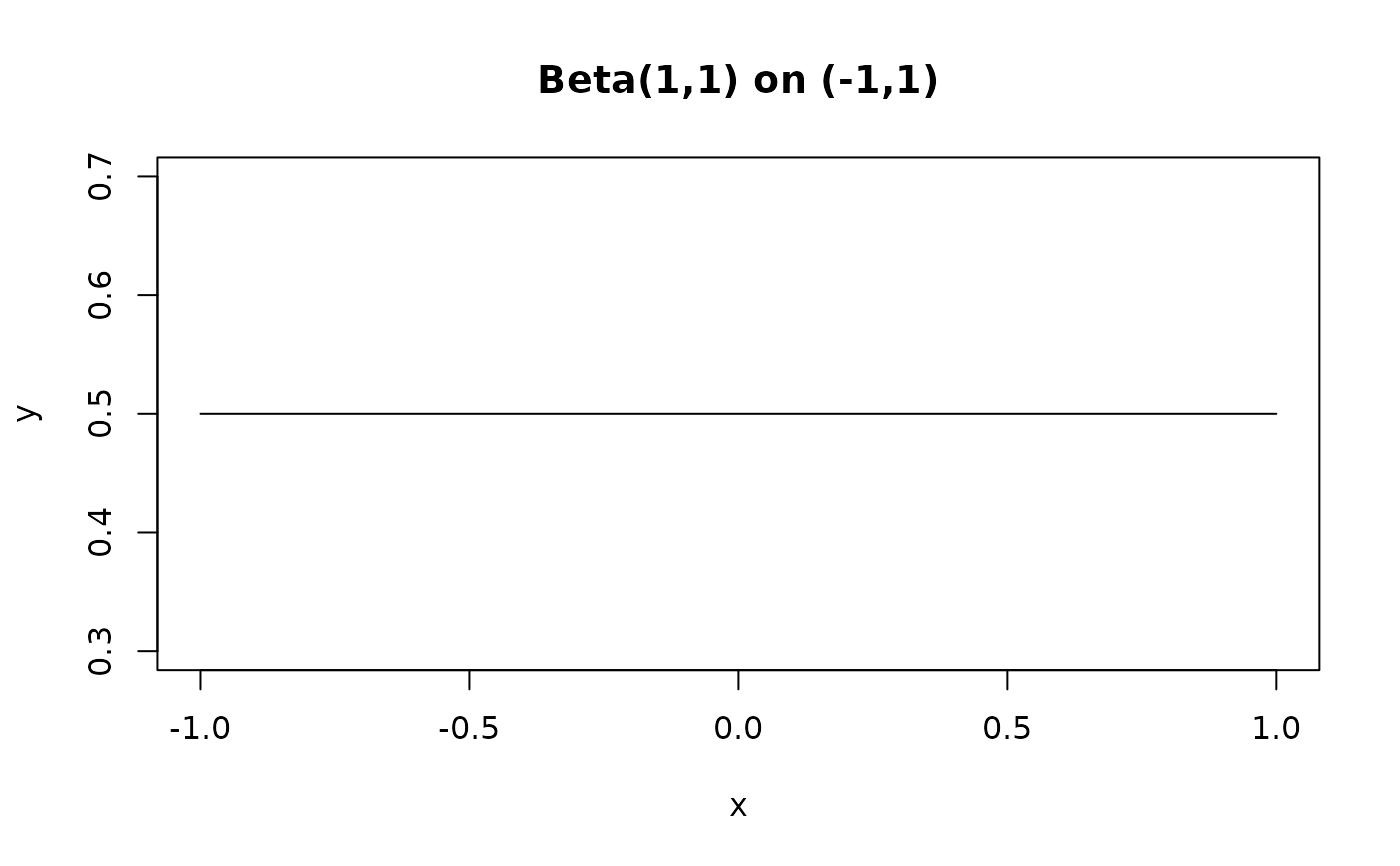
 # Beta(1,1) i.e. uniform on (-1, 1)
x <- seq(-1, 1, length.out = 100)
y <- dbeta_box(x, shape1 = 1, shape2 = 1, a = -1, b = 1)
plot(x, y, type = "l", main = "Beta(1,1) on (-1,1)")
# Beta(1,1) i.e. uniform on (-1, 1)
x <- seq(-1, 1, length.out = 100)
y <- dbeta_box(x, shape1 = 1, shape2 = 1, a = -1, b = 1)
plot(x, y, type = "l", main = "Beta(1,1) on (-1,1)")